In November 2019, I contributed to building modular Internet-enabled Unmanned Ground Vehicles (UGVs) controlled and monitored from the Web.
I was responsible for designing the system architecture and building Web-based platform to control and monitor all the vehicles in real-time.
Here, I’d love to share what I’ve learned on the level of hardware and software.
Project Background
The aim of this project is to serve engineering students as a research platform where they can implement a proof of concept of their researches as quickly as possible. Thus, the system architecture should be modular as much as possible to serve different kinds of academic researches, where each research focuses on one module of interest. Some researches focues on communications between the vehicles, others concerns about image processing, motion planning, localization, and so on.
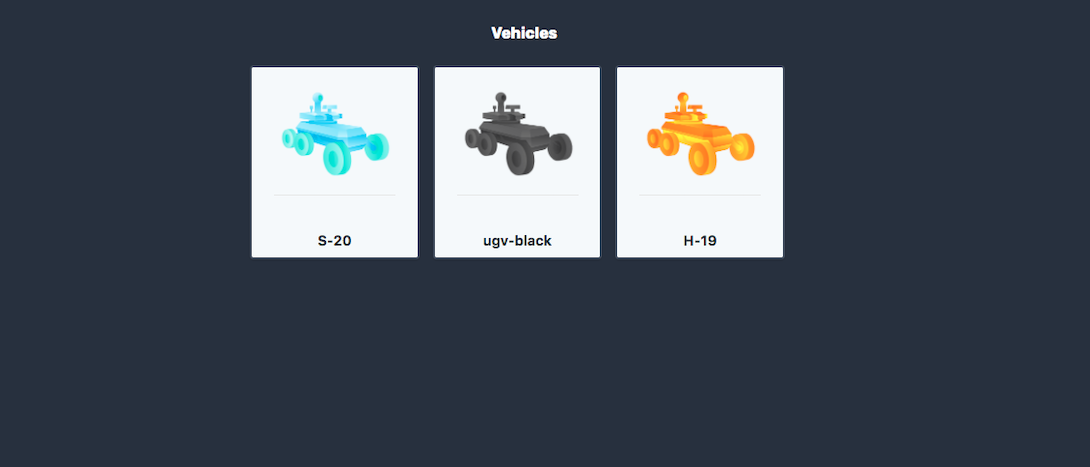
Below are three prototypes of the vehicles of which we want to monitor and control. For a generic IoT platform, you may replace the vehicles with any embedded system for, lets say, industrial use cases or home automation.
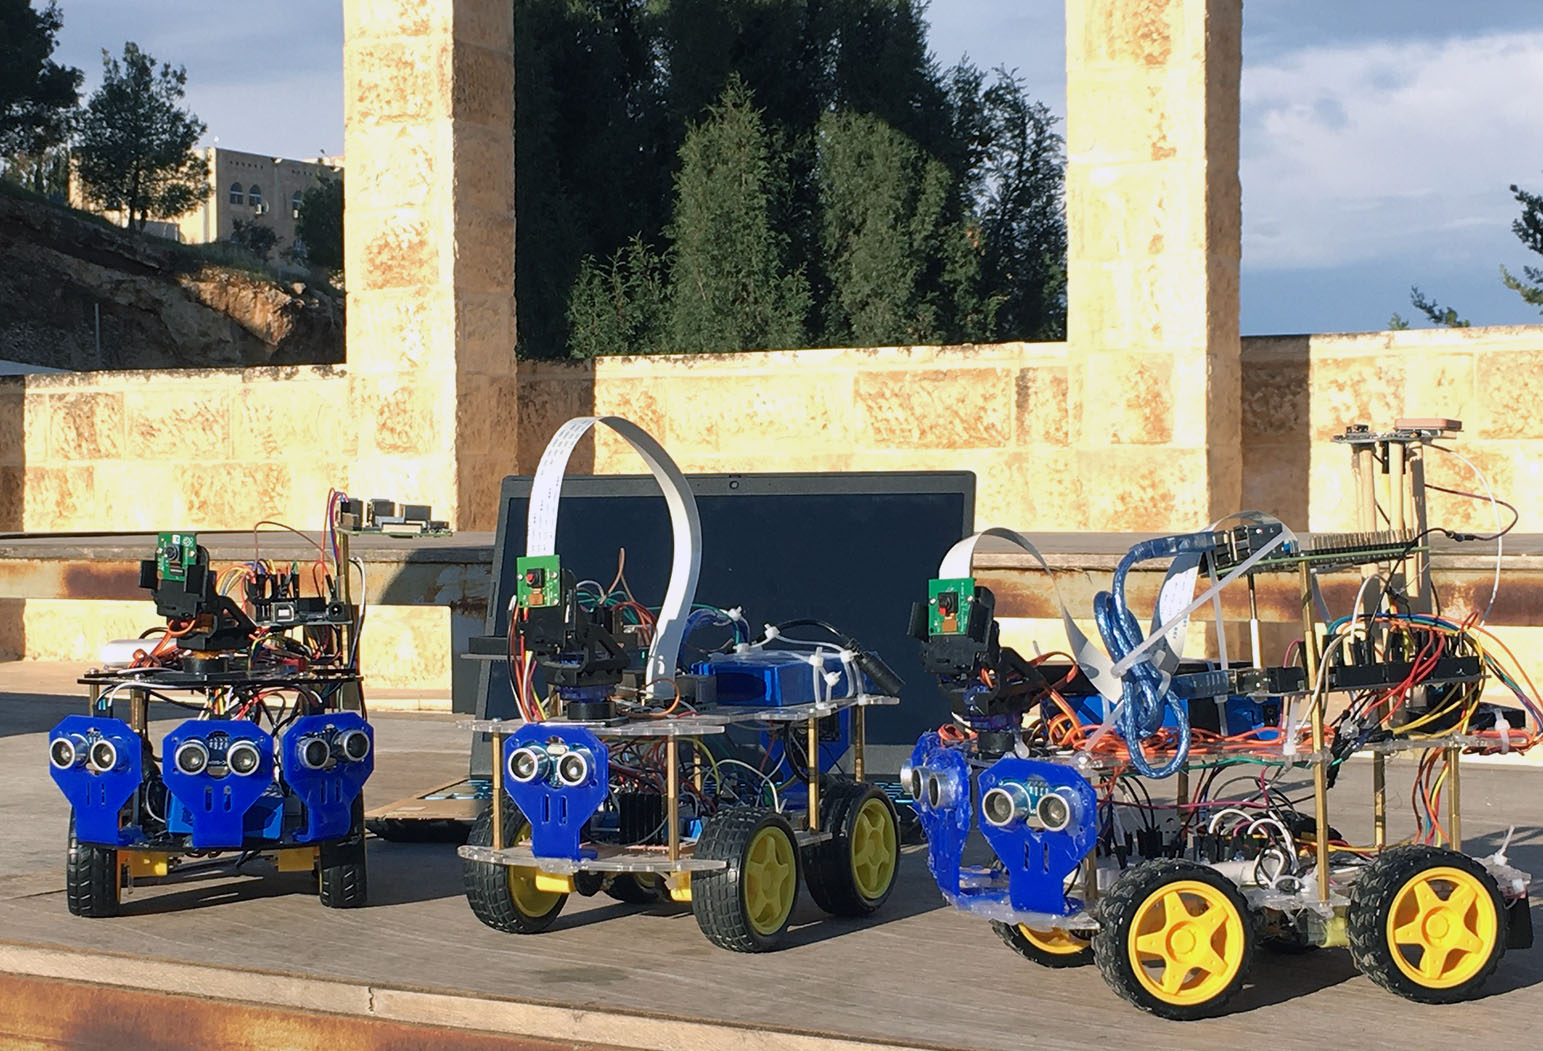
UGV Prototypes.
Those vehicles are monitored and controlled from a real-time dashboard accessd from the Web. I intentionally choosed the Web to be the platform (over Mobile/Desktop apps) since it’s accessable from any device and much easier to build and deploy.
Embedded Hardware
Each vehicle is equipped with two microcontrollers: ATMEGA2560 and Raspberry Pi. 6 Ultrasonics for obstacle avoidance. 4G shield for Internet connectivity. ZigBee module for V-to-V communication. GPS and compass modules for navigation. 8MP camera.
The ATMEGA2560 handles primitive actions on the low level of the hardware (especially for vehicle movements/sensors readings). The Raspberry PI is for the heavy work, offline video recording, live streaming, and to provide Internet connectivity via Wi-fi or the mounted 4G module.
The two microcontrollers have bidirectional communication via serial port: the RPI sends commands to the ATMEGA2560, and the latter sends telemetry data to the former. The RPI is connected to the cloud via Microsoft Azure where it receives commands from the operators using the real-time dashboard, and send the telemetry data to the cloud.
Embedded Software
The Raspberry PI periodically checks for its Internet connection, if it’s lost, it will search for the nearest vehicle to connect to it through the mounted ZigBee modules. And a master-slave communication starts.
If no vehicles were found: it will activate the autonomous mode. In this mode, the aim of the vehicle is to go back to the base station of which its coordinates was saved on vehicle’s startup, trying to avoid all the obstacles along the way.
Operator Control Unit (Dashboard)
The dashboard – where the remote operator can control the vehicle movements and its mounted camera, view a real-time video streaming and the telemetry data sent from the vehicle.
It’s a single-page application, the front-end is built with Vue.js and Tailwind, and is deployed on Vercel.
Dashboard
Here are some of implemented features:
Connectivity Status
Every 5 seconds, a heartbeat signal is sent to test the connectivity between the dashboard and the vehicle. The dashboard’s connectivity’s bar displays the status of the connection and its latency.

Connectivity status bar
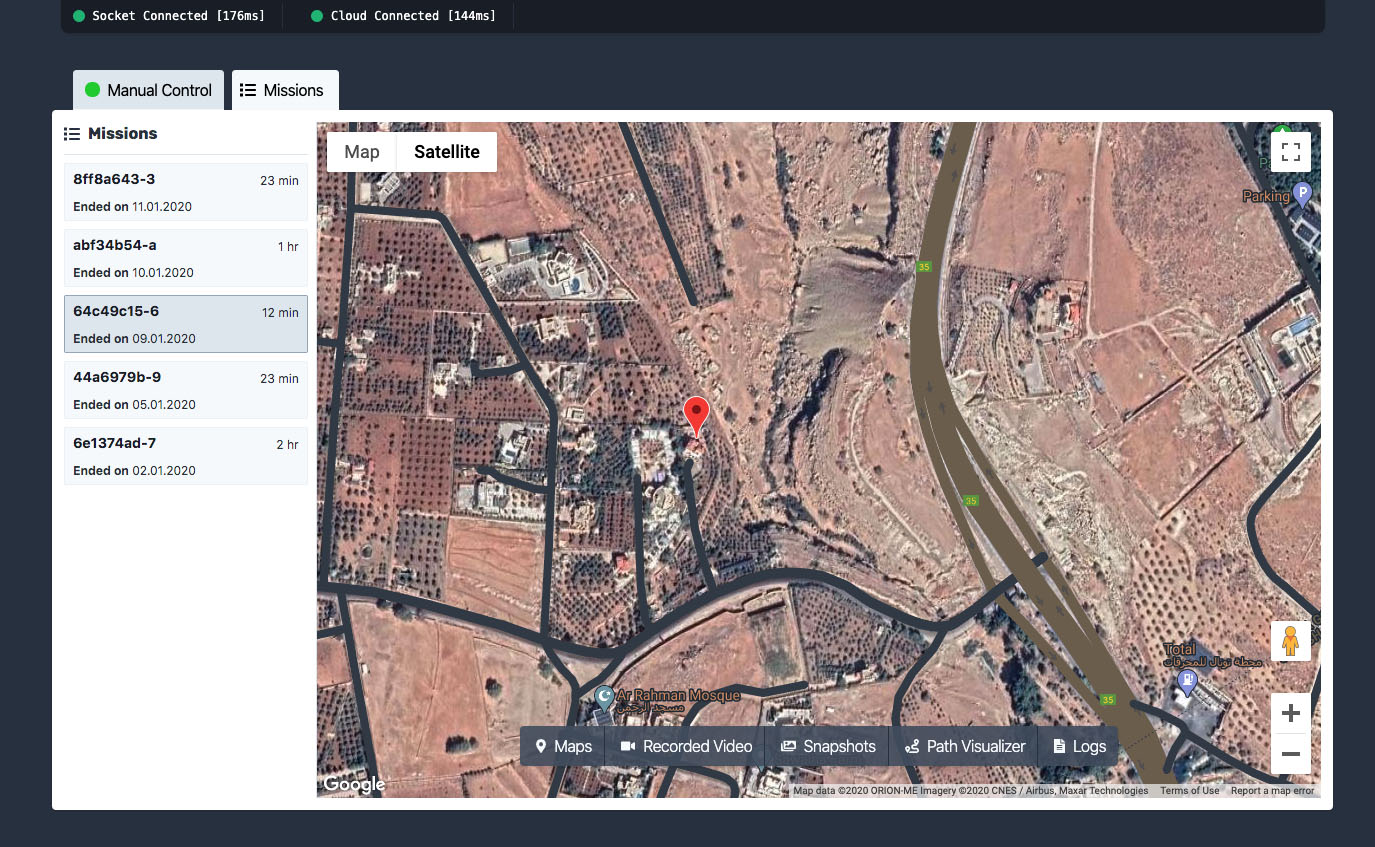
Missions tracking
A mission represents a task on which the vehicle moves towards a certain goal, record a full video, taking different snapshots, collects the required data, and goes back to the station. A mission starts at the beginning of the operating time of the vehicle, ends when it goes back to the station or when it turns off.
During the mission
- A full video is recorded
- Every 5 seconds, a snapshot is taken
- All the collected data are saved locally on the SD card and uploaded to the cloud if the Internet connection is available.
On the dashboard side, the operator is able to view the collected data. It’s displayed as the following:
Maps (Outdoor Localization)
Using Google Map’s APIs, the collected coordinates of the vehicle’s route are dropped as markers on the map.
Recorded video and Snapshots
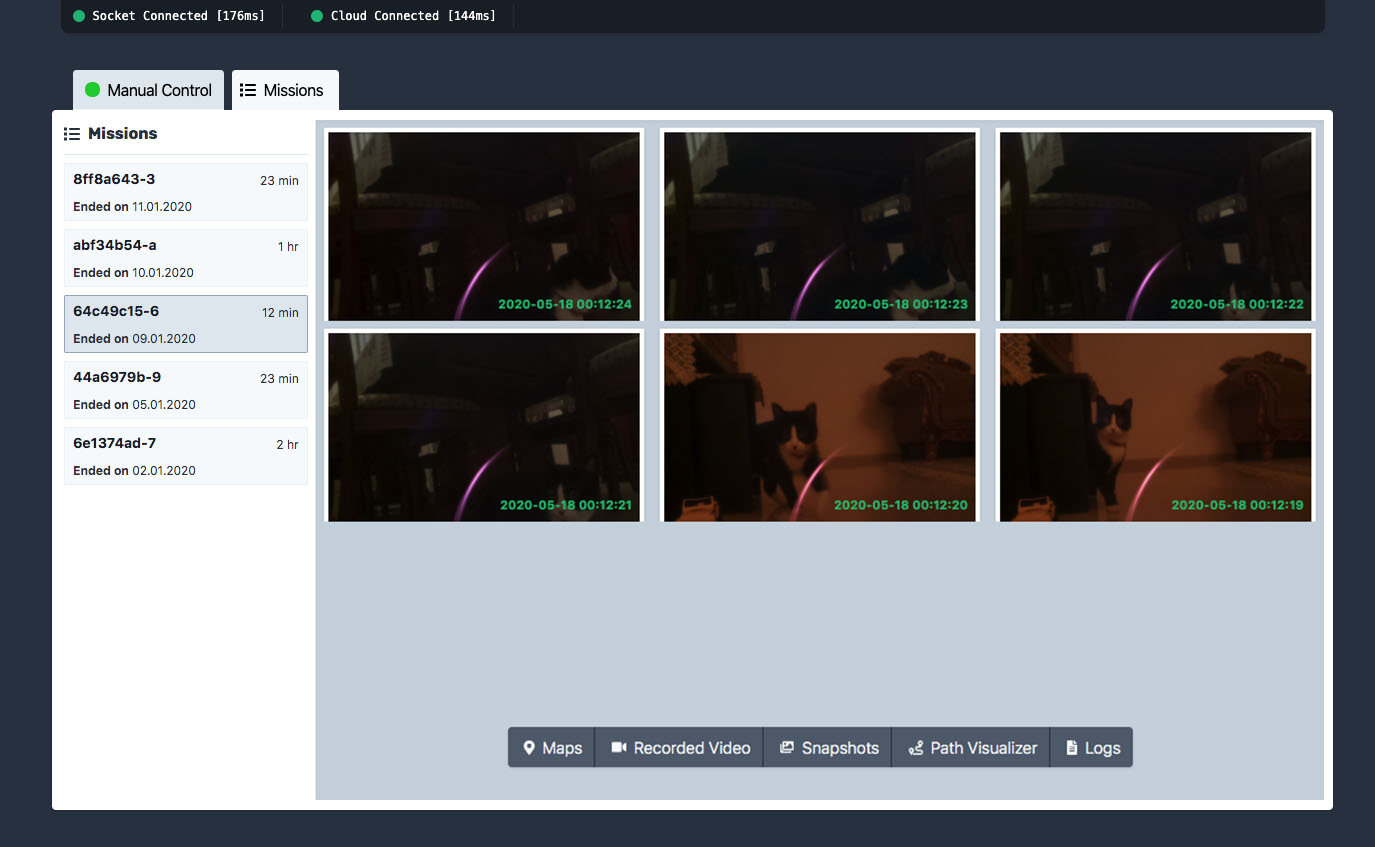
Snapshots
Path Visualizing
The GPS is not accurate for indoor localization. To precisely visualize the path a vehicle has taken, it needs to be able to measure its own motion. Thus, 2 parameters are needed to determine the relative location of the vehicle at a certain moment of time:
- The direction of movement (angle) – which can be obtained from the compass.
- The distance – which can be obtained from speed * time.
- With these parameters, x and y coordinates can be sampled over the operating time.
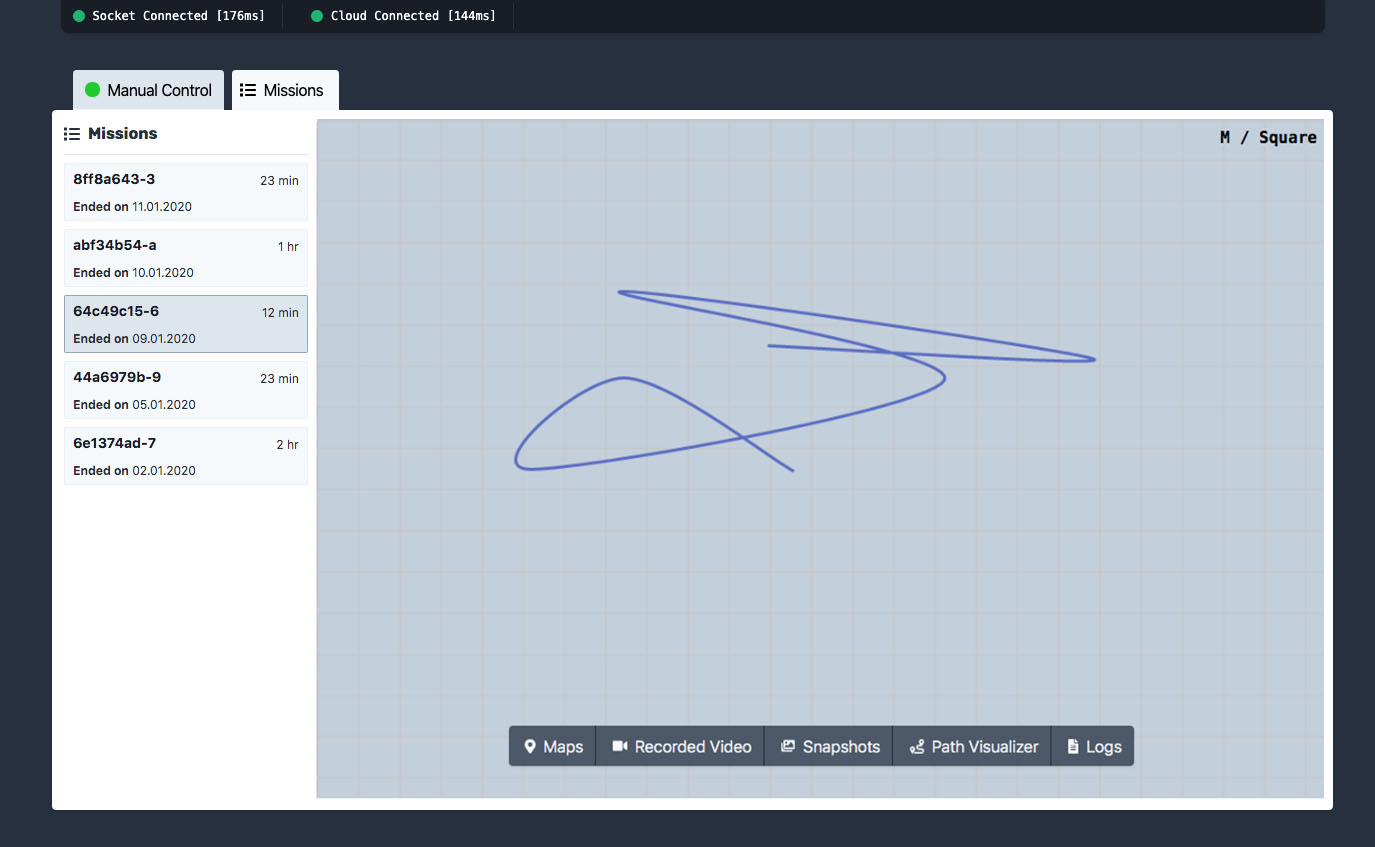
Path Visualizing
Logs
- During operating time, log messages are streamed to the cloud reporting different states/messages from the vehicle.
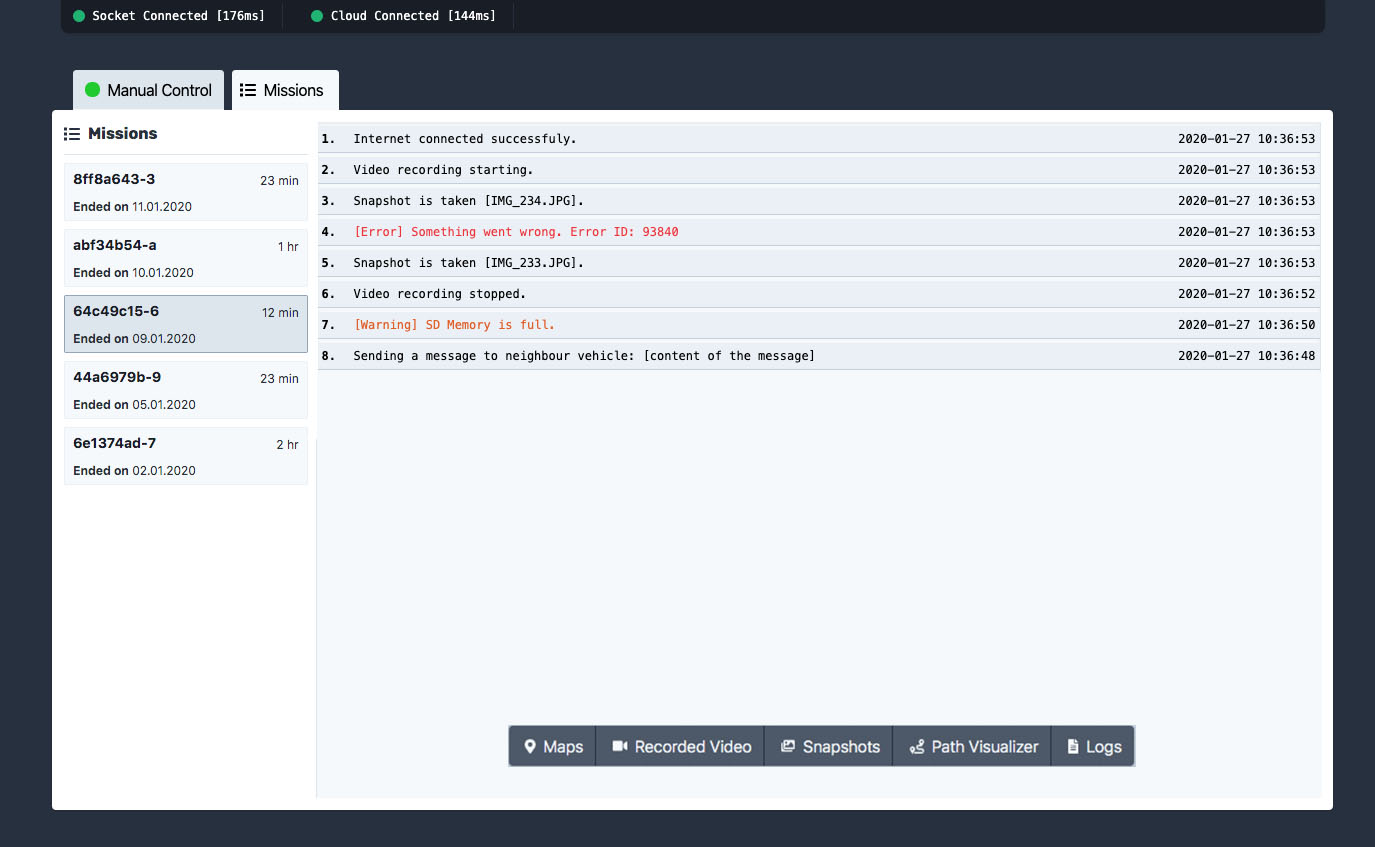
Logs
Technical Overview
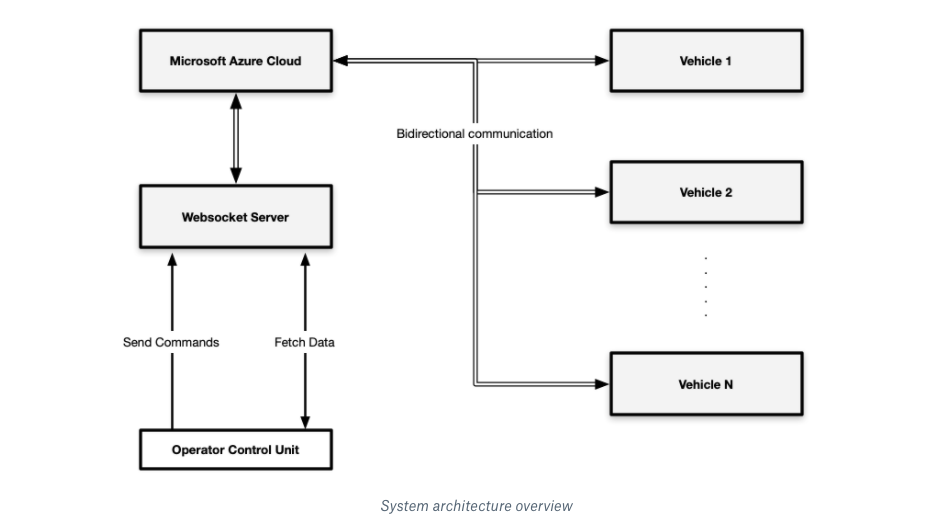
As I mentioned above, the cloud-to-vehicle and vehicle-to-cloud communication are built with Microsoft Azure and a dedicated Websocket server.
Several Azure products have been used:
- IoT Hub for vehicles management and device message ingress. Each vehicle is registered as a device in the IoT Hub. Any message sent to the IoT Hub devices will trigger an EventGrid event.
- Azure Function – whenever an EventGrid event is triggered (when a message is received from the vehicle), an Azure Function is executed to save the message into Azure Storage.
- Azure Storage / Tables – to store messages and commands for the long-term.
The dashboard shouldn’t communicate directly with the cloud for security reason. You need to hide your cloud credentials keys behind a server-side code, so no one can see them. Then the server establishes the connection with cloud and expos the required API for the whatever client you want.
I exposed two endpoints as demonstrated in the above figure, a. to send commands and b. to fetch data.
Why Websocket?
I need an open bidirectional communication with the cloud. This could not be done with the usual HTTP server. The websocket provides the a full-duplex communication channel between the client and the server.
Telemetry Data
How telemetry data are sent from the vehicles to the dashboard?
Every second, the RPI sends fetch command to the ATMEGA2560 telling it to send the current data. (View ATMEGA2560 message constructing code)
Telemetry Data Structure
Messages are constructed from the vehicle side as JSON and sent to the IoT Hub. Here are two samples of the messages:
Path message
{
    "mission_id": "8ff8a643-3a29-4e19-9f00-8fad0319f715",
    "message":
    {
        "type": "path",
        "timestamp": 1581513256,
        "payload":
        {
            "angle": 65.29418,
            "speed": 4.424,
        }
    }
}
Log message
{
    "mission_id": "44a6979b-9891-4145-9dd8-41a04f67db3f",
    "message":
    {
        "type": "logs",
        "timestamp": 1581519256,
        "payload":
        {
            "text": "Memory full.",
            "type": "warning"
        }
    }
}
The type and payload change according the type of message you want to send.
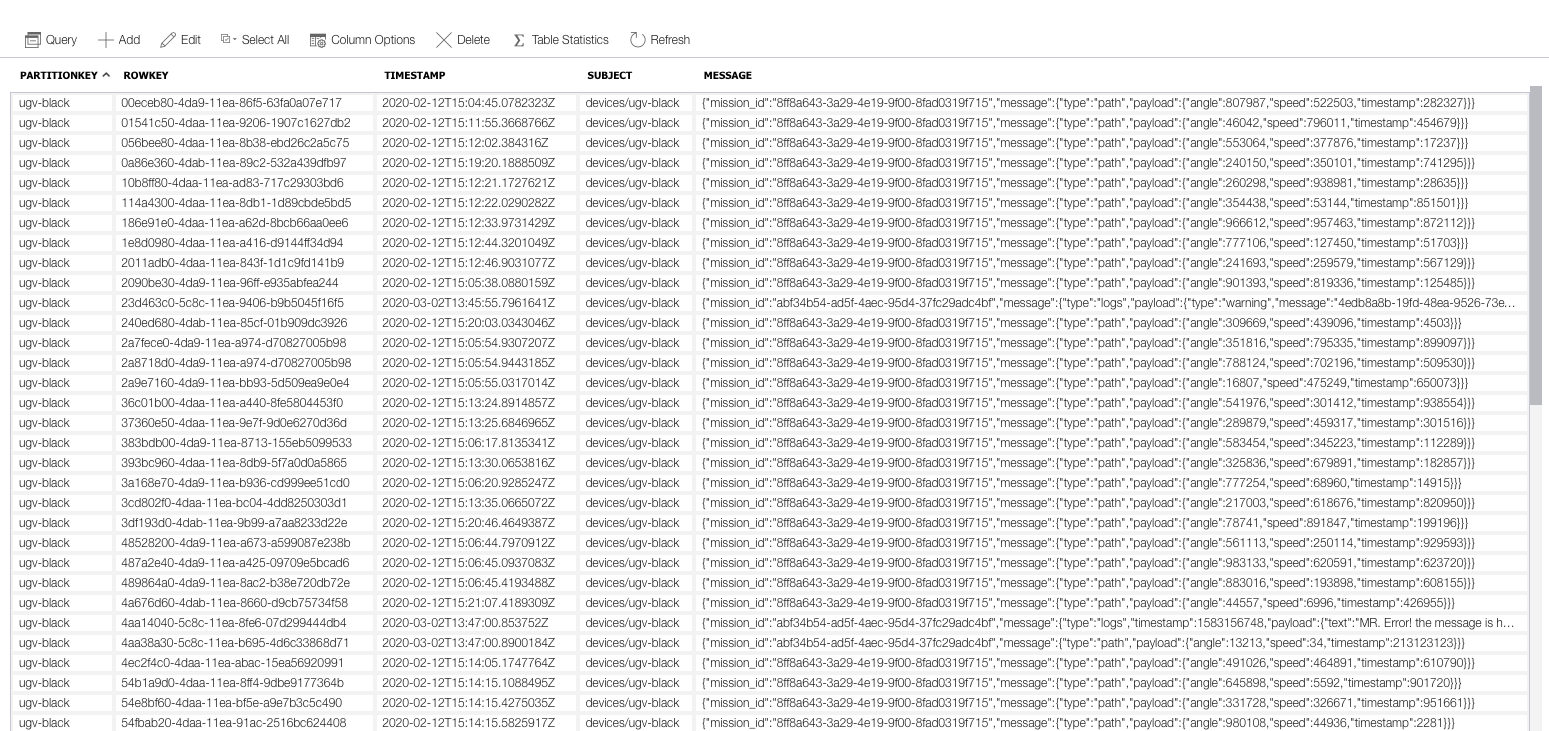
All messages once received to the IoT hub, and the Azure Function is executed, are saved on the Azure Storage as below.
Checking Device Connectivity
How to know if the vehicle is connected or not? There are several solutions. I wrote up an article discussing the different patterns for it: Checking Device Connectivity
Credits
This project couldn’t be done without the help and huge contribution of Dr. Tarek Tutunji, Mohammad Salah, and Hisham Abdalqader.